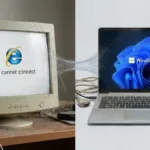
Intel’s income is down and the PC market is taking a battering. The company won’t go bankrupt. Phew! But, it needs to figure out something for the post-PC era.
I could say a whole bunch about why it’s hard to see things turning around at Intel because they just don’t get the way computing is going. I could talk about the fact that they have made zero changes in their culture or organization that show they have a longer term vision that is bigger than, “We are going ultra-mobile.

I could mention the fact that they are getting their butts handed to them by ARM (there was a time when ARM wasn’t even a pimple on Intel’s butt and now, it is a whole new butt with its own grind – end of analogy).

What’s the point? You can’t turn this giant hunk of manufacturing around on a dime. You couldn’t stop the Titanic on a dime, either, and look what happened there.
I don’t think this is the last bad quarter we will see, and I don’t think the PC slump is every going to stop slumping for a long time.
Here’s the dish straight from Intel’s announcement:
Q2 Key Financial Information and Business Unit Trends
- PC Client Group revenue of $8.1 billion, up 1.4 percent sequentially and down 7.5 percent year-over-year.
- Data Center Group revenue of $2.7 billion, up 6.1 percent sequentially and flat year-over-year.
- Other Intel® Architecture Group revenue of $942 million, down 3.7 percent sequentially and down 15.0 percent year-over-year.
- Gross margin of 58 percent, up 2 percentage points sequentially and down 5 percentage points year-over-year.
- R&D plus MG&A spending of $4.7 billion, in line with the company’s expectation of approximately $4.7 billion.
- Tax rate of 26 percent.
| Financial Comparison | |||
| Quarterly | |||
| Q2 2013 | Q1 2013 | vs. Q1 2013 | |
| Revenue | $12.8 billion | $12.6 billion | up 2% |
| Gross Margin | 58.3% | 56.2% | up 2.1 pts. |
| Operating Income | $2.7 billion | $2.5 billion | up 8% |
| Net Income | $2.00 billion | $2.05 billion | down 2% |
| Earnings Per Share | 39 cents | 40 cents | down 3% |
Business Outlook
Intel’s Business Outlook does not include the potential impact of any business combinations, asset acquisitions, divestitures or other investments that may be completed after July 17.
Q3 2013
- Revenue: $13.5 billion, plus or minus $500 million.
- Gross margin percentage: 61 percent, plus or minus a couple of percentage points.
- R&D plus MG&A spending: approximately $4.8 billion.
- Amortization of acquisition-related intangibles: approximately $70 million.
- Impact of equity investments and interest and other: approximately $400 million net gain.
- Depreciation: approximately $1.7 billion.
Full-Year 2013
- Revenue: Approximately flat year-on-year, down from prior expectations of low single digit percentage increase.
- Gross margin percentage: 59 percent, plus or minus a couple percentage points, down from prior expectations of 60 percent, plus or minus a few of percentage points.
- R&D plus MG&A spending: $18.7 billion, plus or minus $200 million, down $200 million from prior expectations.
- Amortization of acquisition-related intangibles: approximately $300 million, unchanged from prior expectations.
- Depreciation: $6.8 billion, plus or minus $100 million, unchanged from prior expectations.
- Tax Rate: approximately 26 percent for each of the remaining quarters of the year.
- Full-year capital spending: $11.0 billion, plus or minus $500 million, down $1.0 billion from prior expectations.


