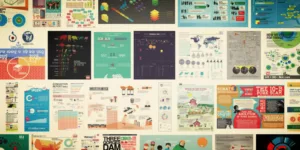
Infographics can be defined as bigger graphics that have images and text contents, and are meant to give more detailed information. They are used extensively in digital marketing campaigns, because they are capable of triggering viral sharing in blogs and social media networking sites.
Infographics are also very effective for giving presentations, with facts and figures. The images grab the attention of viewers, and then they can refer to the text for detailed info.
Reasons why visual infographics are so effective
- Many people tend to have a short attention span, but they can focus rather quickly if presented with captivating images, rather than text paragraphs. Infographics are interesting and engaging in comparison to text reading.
- People are bombarded with loads of information on the internet. The idea of using infographics is not just to give out information, but also to gain attention quicker. Most people cannot remember half the information they read, but can easily retain visual information in their minds.
- Businesses can use these graphics to gain online authority in their niche, and reach out to a wider scope of targeted audiences. It will help in increasing website traffic and profitability. If designed with the right content, layout, and design, then it has the potential to give great leverage to your ROI, which is what all businesses desire.
- An interesting infographic gets shared quickly, because social media users and bloggers get something to chat about. In the process, your brand gets good exposure and quality backlinks. Including business logo and URL allows for building brand awareness and credibility in the long run.
- Infographics are a natural link building strategy that can help in getting quality backlinks to your sales pages. Eye-catching images draw attention and results with social sharing.
- You can give better authority to your image ads by using statistics and graphs. Consumers may not consider randomly made statements, but if stats ate included, it makes your message sound more credible.
- A research report reading can be turned into an interesting story, by adding the visual elements. Viewers prefer checking out the highlighted important points, in comparison to reading lengthy text to locate the key data.
How to create effective infographics?
Infographic can make you business appear smart in your niche. It is a way to attract prospects, and then turning them into followers. Now let’s understand how to create a successful infographic.
- Simple – Keep the infographic simple, because adding too many images can make it look cluttered, and viewers will lose focus. Too much text can be indigestible, and push the readers away. Use factual data and compelling graphics, but don’t overdo it.
- Unique – Consumers will not connect with similar looking infographics. Make sure that you customize the templates, so that consumers relate it with your business.
- Easily shareable – Sharing of your infographic on social media can help in bringing in more traffic to your own website. Remember to add social sharing buttons, so readers can share it quickly. Backlink your website to the Ad, so that people can easily visit your website with 1 click.
Steps to create an infographic
Before creating an infographic you can read the helpful posts on https://visme.co. They also provide the best infographic builder tool online.
Collect data
The first step will be to collect statistics and information from trusted sources. It is good to mention your sources in the graphic or post.
Organize data
Next step is to organize this data on the image layout. You will need to convey the message in a unique and interesting way. You can use online infographic builder tools for creating these art-works in minutes.
Colors
Keep the look of your infographic professional by choosing appropriate colors. Make sure it does not look too flashy with too many colors. Balance your color tones properly.
Fonts & graphics
Usage of many graphics and font styles cause confusions. Maintain same style across images, and stick to a couple of fonts for good effects.
Layout
Create the design by maintaining the uniformity within the layout. It helps viewers locate information easily and quickly.
Finally , check the visuals on the basis of components, color, contrast, combination, and closeness.
With a little practice you will be able to make appealing infographics and increase your exposure.


